2026.3·Ready to execute
All releases · March 17, 2026 · Jan Hellemans
This is the release where Clarida stops being a collection of tools and starts becoming a workflow. You can now go from defining your experiment, designing its setup, all the way to execution. We're not holding the pipet but showing you all details needed and allowing you to take notes that will be relevant in downstream data analysis.
As co-author of the MIQE guidelines and the RDML data format, I believe in standards. Integrated support to make this a help rather than a burden has been lacking. At Clarida, we aim to improve that. Starting small today with tools for RDML and RDES.
Steps to execution.
Jan
New features
From design to execute in one flow
Before this release, experiment design support was very minimal. That changes now with the addition of cycling protocols and run layouts (more on that later).
Importantly, we do not leave you unsupported when doing the actual lab work. A dedicated Execute phase walks you through collecting materials, preparing mixes, filling the plate, and starting the instrument. Your data persists across sessions, so you can close the browser and pick up where you left off.
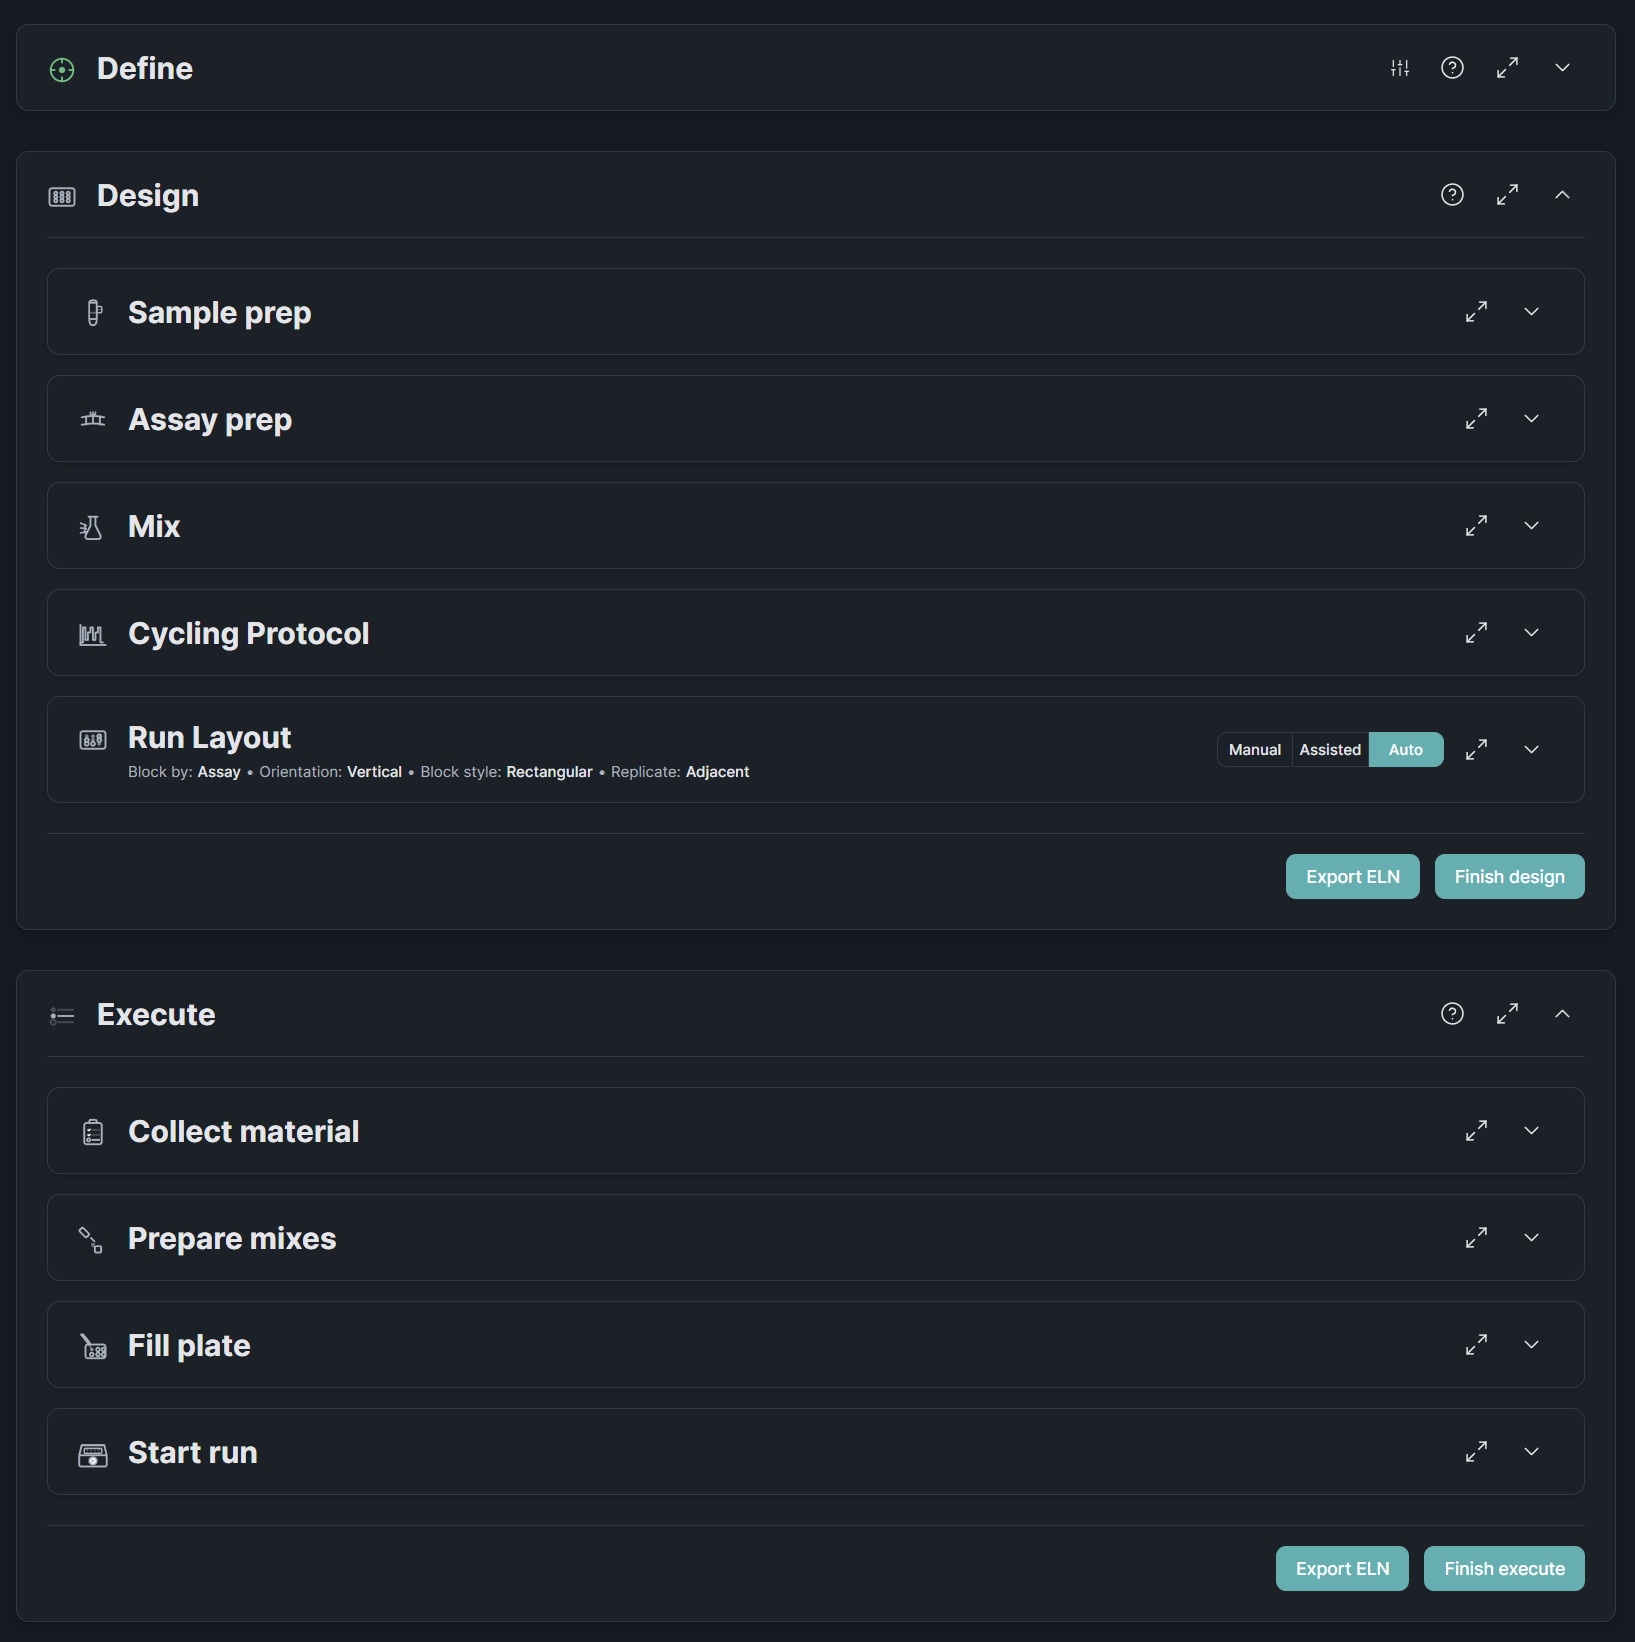
We present you all steps in an ordered workflow that we believe makes sense for most experiments and researchers. We don't force you to stick to this though. Want to define your protocol before listing your assays? No problem. You designed your run layout and realize you have some space left on your plate? Feel free to add some samples, the layout will easily be regenerated.
Automatic plate layout generation
The plate layout is no longer something you sketch on paper or guess in Excel. List your samples and assays, pick a plate format and set replicates, and Clarida generates the well annotation for you. Three modes cover a range of needs: Auto fills the plate in one click based on our best insights, Assisted layouts are generated for you taking into account your preferences, and Manual gives you full control over every well.
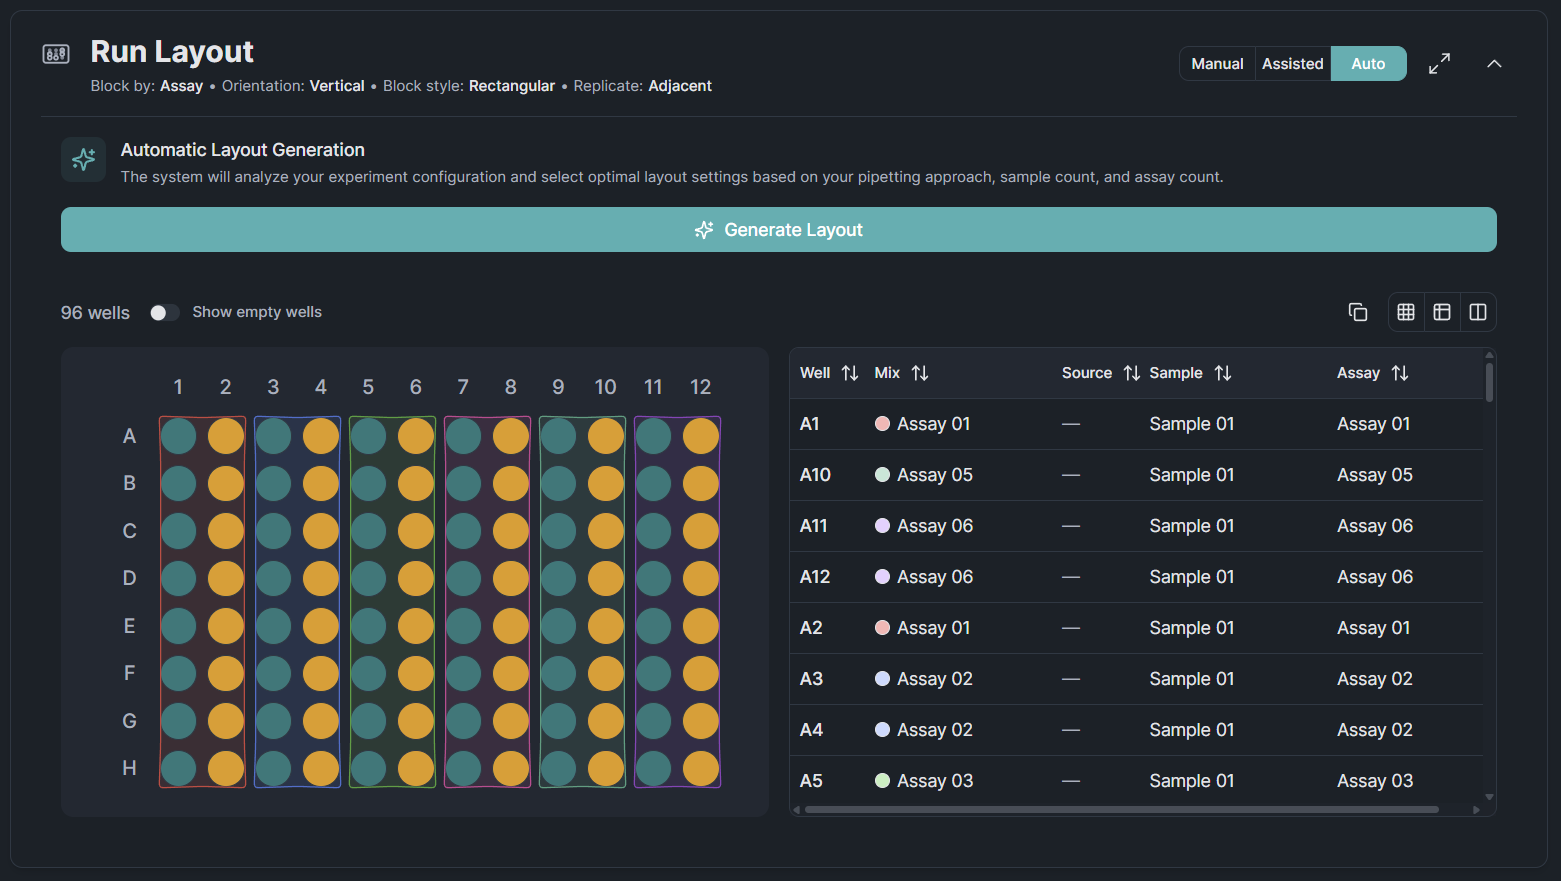
Layout generation currently supports experiments with a single run only. Multi-run layout is planned for the April release.
Validate and explore your RDML files
RDML is the open standard for qPCR data exchange, but validating and inspecting these files has meant downloading desktop software with a dated interface. Our RDML Viewer brings this to the browser: drag in your file, see whether it passes schema validation, and explore amplification curves, melting curves, and run metadata in one place.
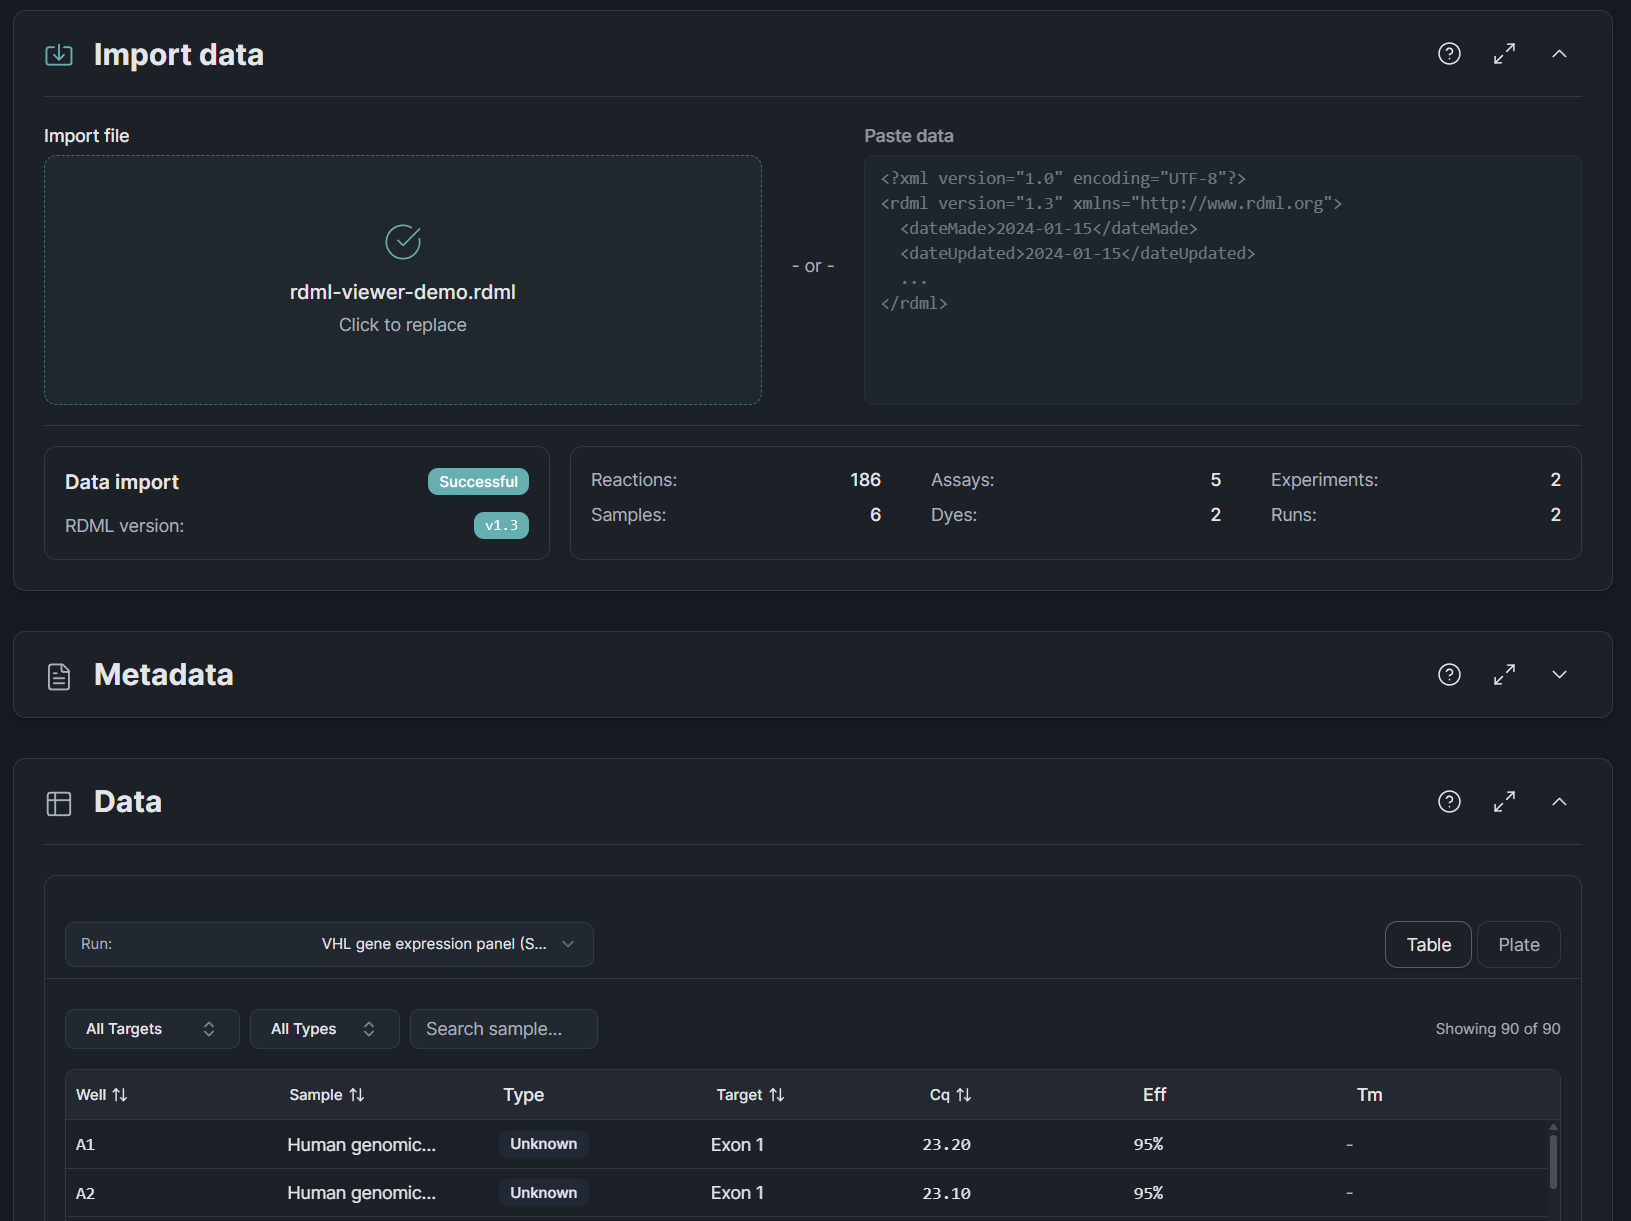
Multi-plate files are supported. Select individual runs from the sidebar to focus on the data that matters. Free for everyone, no account needed.
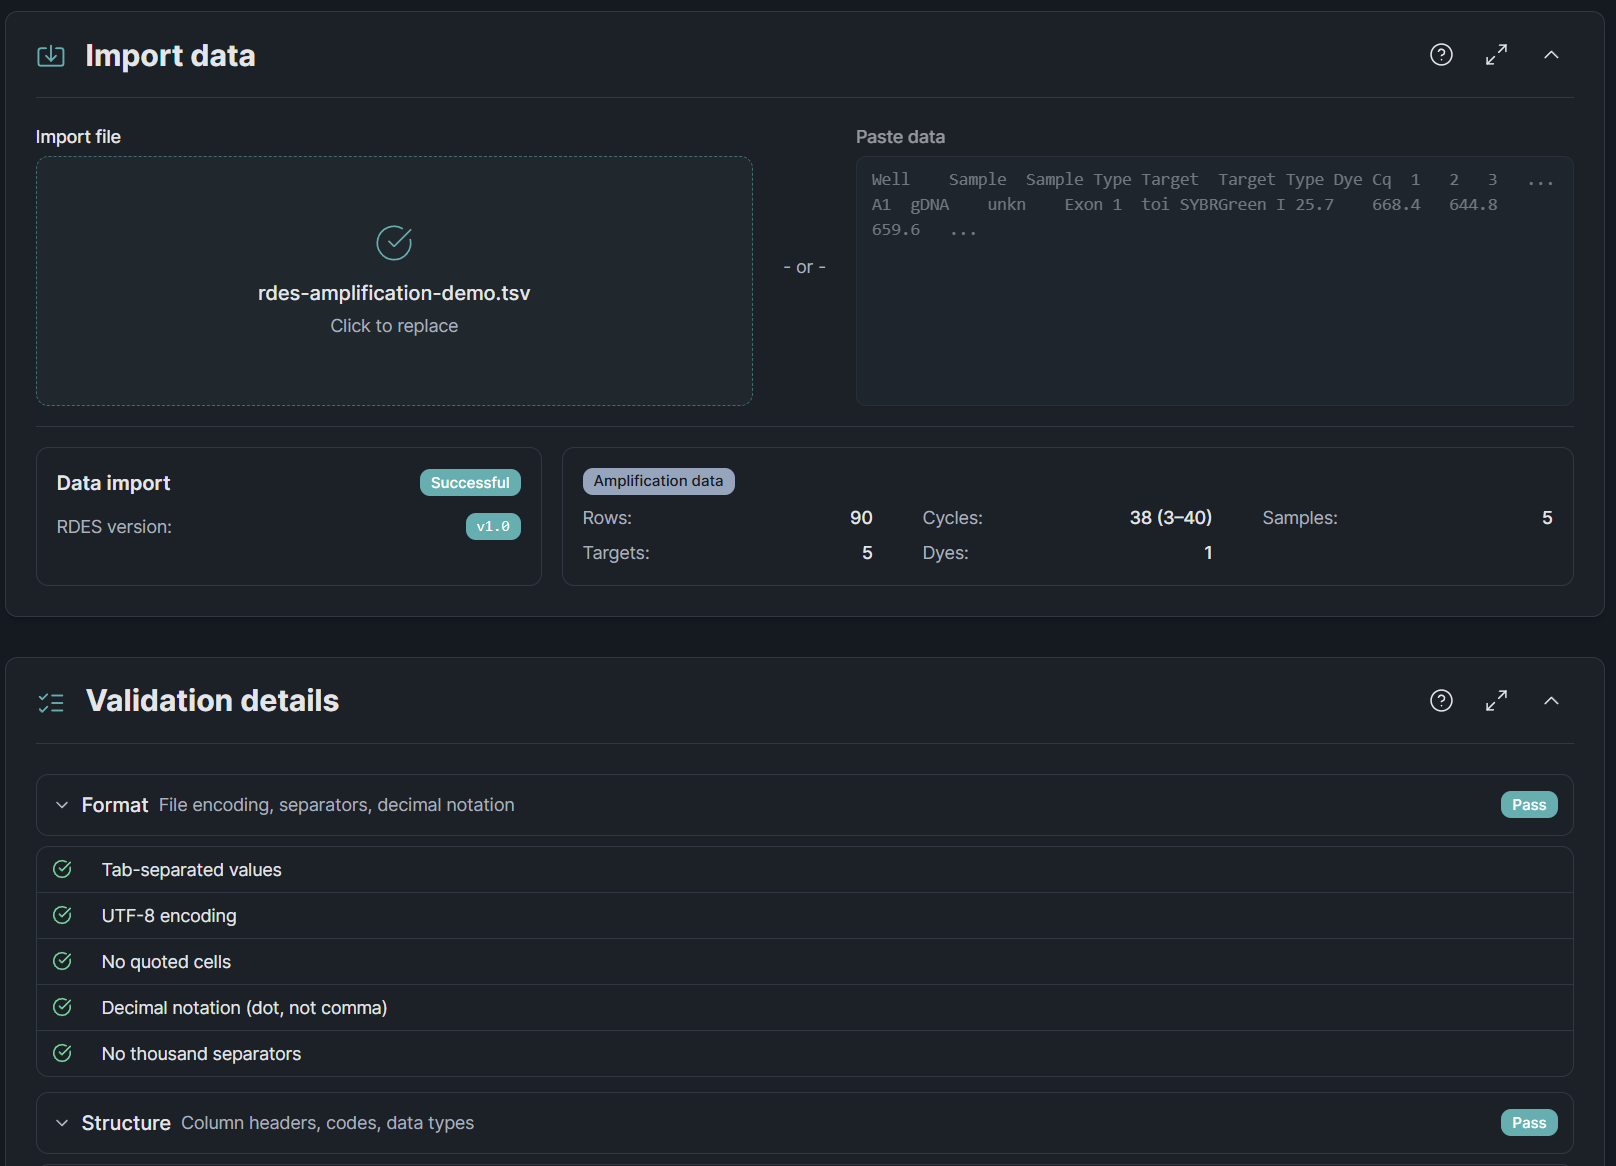
Check your RDES files before submission
The HEROIC Consortium created RDES as a simpler alternative to RDML — a plain spreadsheet format that makes it trivial for journals to require raw qPCR data. The catch: until now, no validation tool existed anywhere. Our RDES Validator is the first. Paste your TSV data or drop a file, and you will know in seconds whether it meets the spec.
Quality of life
- Cite Clarida in your publications · Every tool now has a citation panel with APA, Vancouver, and BibTeX formats. One click to copy, with your access date and platform version filled in automatically. Because proper software citation matters for reproducible science.
- Cleaner settings layout · Run Layout settings moved from inline controls to the aside panel. Each layout mode (auto, assisted, manual) shows only what is relevant, and a compact summary line on the section header tells you the current configuration at a glance.
- Sortable experiments list · Click any column header to sort your experiments by name, date, or status. A small thing, but it makes a difference once you have more than a handful.
- Custom tool icons · Every tool now has its own icon instead of generic placeholders. Subtle, but it makes the sidebar and homepage feel more intentional.
- Smoother chart scrolling · Plotly charts no longer hijack your scroll wheel. Scrolling the page now scrolls the page, no zooming of your charts.
- Sidebar navigation · Section titles in the sidebar are now clickable links back to the homepage. Fewer clicks to get where you need to go.
- Template auto-load · New experiments now start with the standard template pre-loaded instead of a blank slate.
Patch 2026.3.1
- Correct version cited · The citation panel now shows the official release version (e.g., 2026.3.1) instead of an internal build number.